Universities are investing time and money in creating learning analytics systems, but Ed Foster of Nottingham Trent University says these systems are only as good to the support given to staff and students who use them.
As complex as it is, the real challenge of learning analytics isn’t the bit that requires the supercomputer. Yes the technology requires mind-bending quantities of data to be prepared, processed and reported on, and yes that processing needs to be done repeatedly, reliably and quickly.
However, the real challenge remains ‘what happens next?’ At the point where the user has the data in their hands, what do they do to actually make a difference?
Nottingham Trent University started working with technology partner DTP Solutionpath in 2013-14 to develop a learning analytics resource to improve the student experience. The primary users are tutors, their students and support staff. We have focused on putting high quality, timely information in their hands.
Data dashboards becoming normal part of student life
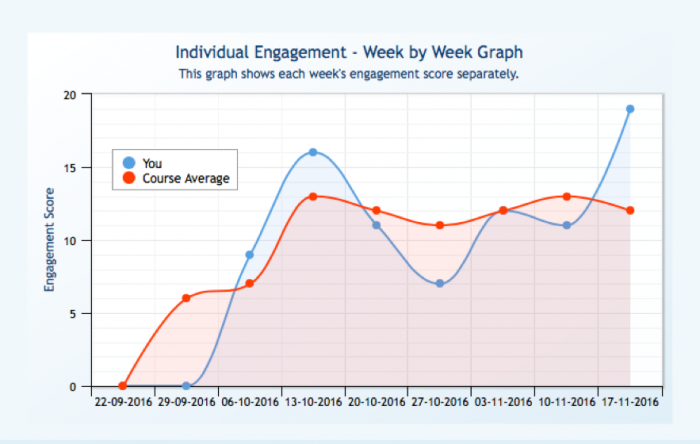
As time progresses, we are also aware of the management information potential, of the new perspectives that the dashboard brings, but it remains primarily a tool for those at the chalkface. The NTU student dashboard analyses students’ engagement with their courses based on library loans, card access to buildings, VLE use and online coursework submissions.
As the university becomes more aware of the meaning behind the data, we are becoming more sophisticated in suggesting key points to look for.
We record attendance and ebook use, although these have not yet added to the core algorithm. The dashboard then generates an engagement rating for each student: high, good, partial or low. There is a strong correlation between engagement measured in the dashboard and both progression and final degree attainment.
The dashboard is becoming a normal part of university life. Last year more than 2,000 staff used it, as did 26,000 of our students. This is by design; there are no hidden report screens; all users see the same information. Students find it particularly useful to discuss the information contained in their dashboard during tutorials. Moreover, our most recent analysis shows a strong correlation between the frequency a student logs into the dashboard and their likelihood of progression: students who use the dashboard more often are more likely to progress.
Our current developmental priorities are not about data sources or algorithms, but improving the quality of interventions raised by the data. As anyone with a register knows, the problem is not marking missing students as absent, but persuading them that their best course of action is to attend the next class. We are therefore working on strategies that enable staff to make best use of the dashboard data, but also continue to give students power over their own learning.
Tutors are encouraged to periodically check on their students’ engagement. We recently wrote to all staff users asking them take a mid-term review and check the engagement of students in their tutor groups. As the university becomes more aware of the meaning behind the data, we are becoming more sophisticated in suggesting key points to look for.
This year we conducted a series of trials as part of our new student induction. Students were encouraged to complete a short self-evaluation within the dashboard asking them to explore issues about becoming a university student. Their answers will be used as a reference point or discussion starter in tutorials. Finally, we will commence a goal setting pilot in the second term. This will give students the opportunity to set and check progress against a series of personal goals.
Learning analytics provide institutions with potentially valuable sources of new data. The challenge remains to actually use this data in ways to improve the student experience. Any institution thinking of using learning analytics will need to ensure that they invest not just in the technology, but also in helping staff and students to actually use it.


